Note
- This tutorial is also available on nbviewer, offering an alternative platform for your learning convenience.
- 🔥 Free Pandas Course: https://hedaro.gumroad.com/l/tqqfq
Description:
You are a Fintech professional at a leading investment firm, and your team is analyzing the performance of various hedge funds. Your manager has asked you to create a report that provides insights into the funds’ performance, but the data is messy and needs to be cleaned and transformed before analysis can begin.
Tasks:
- Fill Missing Returns: Use the ffill method to fill missing values in the ‘Returns’ column, assuming that missing values are a result of no trading activity.
- Normalize Returns Data: Normalize the ‘Returns’ data to a range of 0 to 1.
- Remove Duplicate Rows: Remove duplicate rows that have the same ‘Fund’ and ‘Date’ values.
# import libraries
import pandas as pd
import numpy as np
import sys

print('Python version ' + sys.version)
print('Pandas version ' + pd.__version__)
print('Numpy version ' + np.__version__)
Python version 3.11.7 | packaged by Anaconda, Inc. | (main, Dec 15 2023, 18:05:47) [MSC v.1916 64 bit (AMD64)]
Pandas version 2.2.1
Numpy version 1.26.4
The data
The dataset consists of daily returns data for 100 hedge funds, with additional columns for assets under management, investment strategy, and volatility. The data is messy, with missing values and duplicate rows, and requires cleaning and normalization before analysis can begin.
Columns:
- Fund: The name of the hedge fund
- Date: The trading date (in datetime format)
- Returns: The daily returns of the fund with missing values and a large range
- Assets: The total assets under management by the fund
- Strategy: The investment strategy used by the fund (Equity, Fixed Income, or Multi-Asset)
- Volatility: A numeric column representing the annualized standard deviation of each hedge fund’s returns, expressed as a percentage.
# set the seed
np.random.seed(0)

# data
data = {
    'Fund': ['Fund {}'.format(i) for i in range(1, 101)],
    'Assets': np.random.randint(low=1000000, high=100000000, size=100),
    'Strategy': np.random.choice(['Equity', 'Fixed Income', 'Multi-Asset'], size=100),
    'Volatility': np.random.uniform(low=0, high=100, size=100),
    'Returns': [np.random.uniform(low=-500, high=500, size=252) for _ in range(100)]
}

# create dataframe
df = pd.DataFrame(data)

# unpack the lists in the 'Returns' column
df = df.explode('Returns')

# reset the index
df = df.reset_index(drop=True)

# add missing values
df.loc[np.random.choice(df.index, 50), 'Returns'] = np.nan

# add duplicates
extra_rows = df.iloc[np.random.choice(df.index, size=int(0.05*len(df)), replace=False)]
df = pd.concat([df, extra_rows])

# add a new column 'Date' with a specific date range
date_range = pd.date_range(start='2022-01-01', end='2022-12-31')
df['Date'] = np.random.choice(date_range, size=len(df))

# reorder the columns
df = df[['Fund', 'Date', 'Returns', 'Assets', 'Strategy', 'Volatility']]

df.head()| Fund | Date | Returns | Assets | Strategy | Volatility | |
|---|---|---|---|---|---|---|
| 0 | Fund 1 | 2022-12-17 | -222.371294 | 76434668 | Multi-Asset | 65.210327 |
| 1 | Fund 1 | 2022-06-24 | 86.784346 | 76434668 | Multi-Asset | 65.210327 |
| 2 | Fund 1 | 2022-10-01 | 363.855606 | 76434668 | Multi-Asset | 65.210327 |
| 3 | Fund 1 | 2022-04-07 | -382.468144 | 76434668 | Multi-Asset | 65.210327 |
| 4 | Fund 1 | 2022-03-07 | 17.379107 | 76434668 | Multi-Asset | 65.210327 |
Let us check the column data types using df.info()
Since the “Returns” column has both floats and NaNs, Pandas returns the column as an object.
df.info()<class 'pandas.core.frame.DataFrame'>
Index: 26460 entries, 0 to 9581
Data columns (total 6 columns):
# Column Non-Null Count Dtype
--- ------ -------------- -----
0 Fund 26460 non-null object
1 Date 26460 non-null datetime64[ns]
2 Returns 26407 non-null object
3 Assets 26460 non-null int32
4 Strategy 26460 non-null object
5 Volatility 26460 non-null float64
dtypes: datetime64[ns](1), float64(1), int32(1), object(3)
memory usage: 1.3+ MB
We should be able to get df.info() to return the column as float64.
Pro Tip: Do not try to use
.locor.ilocwhen casting to another data type. You will not get any errors, but nothing gets converted. This will save you a lot of time trying to figure out what is going on.
# convert to float
df['Returns'] = pd.to_numeric(df['Returns'], errors='coerce')

df.info()
<class 'pandas.core.frame.DataFrame'>
Index: 26460 entries, 0 to 9581
Data columns (total 6 columns):
# Column Non-Null Count Dtype
--- ------ -------------- -----
0 Fund 26460 non-null object
1 Date 26460 non-null datetime64[ns]
2 Returns 26407 non-null float64
3 Assets 26460 non-null int32
4 Strategy 26460 non-null object
5 Volatility 26460 non-null float64
dtypes: datetime64[ns](1), float64(2), int32(1), object(2)
memory usage: 1.3+ MB
Fill Missing Returns:
Use the ffill method to fill missing values in the “Returns” column, assuming that missing values are a result of no trading activity.
# sort the data
df = df.sort_values(by=['Fund', 'Date']).reset_index(drop=True)

df.head()| Fund | Date | Returns | Assets | Strategy | Volatility | |
|---|---|---|---|---|---|---|
| 0 | Fund 1 | 2022-01-02 | 52.192470 | 76434668 | Multi-Asset | 65.210327 |
| 1 | Fund 1 | 2022-01-03 | -129.147201 | 76434668 | Multi-Asset | 65.210327 |
| 2 | Fund 1 | 2022-01-05 | -101.565741 | 76434668 | Multi-Asset | 65.210327 |
| 3 | Fund 1 | 2022-01-06 | -43.859433 | 76434668 | Multi-Asset | 65.210327 |
| 4 | Fund 1 | 2022-01-06 | -139.454440 | 76434668 | Multi-Asset | 65.210327 |
To apply the ffill() method to each Fund, we need to use the groupby() method.
group = df.groupby('Fund')

# use ffill
df['Returns_ffill'] = group['Returns'].ffill()

df.info()
<class 'pandas.core.frame.DataFrame'>
RangeIndex: 26460 entries, 0 to 26459
Data columns (total 7 columns):
# Column Non-Null Count Dtype
--- ------ -------------- -----
0 Fund 26460 non-null object
1 Date 26460 non-null datetime64[ns]
2 Returns 26407 non-null float64
3 Assets 26460 non-null int32
4 Strategy 26460 non-null object
5 Volatility 26460 non-null float64
6 Returns_ffill 26460 non-null float64
dtypes: datetime64[ns](1), float64(3), int32(1), object(2)
memory usage: 1.3+ MB
Normalize Returns Data:
Use the following formula to normalize the ‘Returns’ data to a range of 0 to 1:
normalized_returns = (returns - returns.min()) / (returns.max() - returns.min())
This will rescale the ‘Returns’ data to a range of 0 to 1, making it easier to analyze and visualize.
df['normalized_returns'] = (df['Returns_ffill'] - df['Returns_ffill'].min()) / (df['Returns_ffill'].max() - df['Returns_ffill'].min())

df.head()| Fund | Date | Returns | Assets | Strategy | Volatility | Returns_ffill | normalized_returns | |
|---|---|---|---|---|---|---|---|---|
| 0 | Fund 1 | 2022-01-02 | 52.192470 | 76434668 | Multi-Asset | 65.210327 | 52.192470 | 0.552172 |
| 1 | Fund 1 | 2022-01-03 | -129.147201 | 76434668 | Multi-Asset | 65.210327 | -129.147201 | 0.370815 |
| 2 | Fund 1 | 2022-01-05 | -101.565741 | 76434668 | Multi-Asset | 65.210327 | -101.565741 | 0.398399 |
| 3 | Fund 1 | 2022-01-06 | -43.859433 | 76434668 | Multi-Asset | 65.210327 | -43.859433 | 0.456111 |
| 4 | Fund 1 | 2022-01-06 | -139.454440 | 76434668 | Multi-Asset | 65.210327 | -139.454440 | 0.360507 |
You can see we were able to rescale the data between 0 and 1.
df['normalized_returns'].plot.box();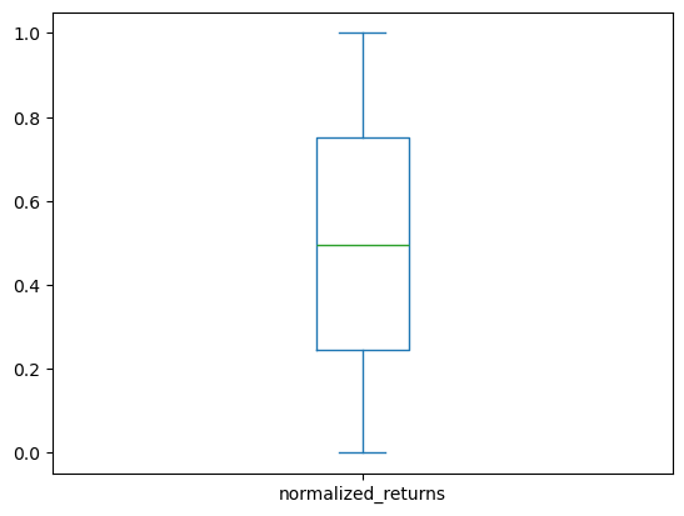
Remove Duplicate Rows:
Remove duplicate rows that have the same ‘Fund’ and ‘Date’ values.
The drop_duplicates() method has a parameter named “subset” that allows us to drop duplicates but only consider a specific set of columns.
clean = df.drop_duplicates(subset=['Fund', 'Date'])

clean.info()
<class 'pandas.core.frame.DataFrame'>
Index: 18839 entries, 0 to 26457
Data columns (total 8 columns):
# Column Non-Null Count Dtype
--- ------ -------------- -----
0 Fund 18839 non-null object
1 Date 18839 non-null datetime64[ns]
2 Returns 18803 non-null float64
3 Assets 18839 non-null int32
4 Strategy 18839 non-null object
5 Volatility 18839 non-null float64
6 Returns_ffill 18839 non-null float64
7 normalized_returns 18839 non-null float64
dtypes: datetime64[ns](1), float64(4), int32(1), object(2)
memory usage: 1.2+ MB
Summary:
The tutorial demonstrates how to clean and prepare financial data for analysis. It starts with a messy dataset of hedge funds’ daily returns, assets, strategy, and volatility. The data is cleaned by filling missing values, normalizing returns data, and removing duplicate rows.
Key Takeaways:
- Fill missing values: Use the
ffillmethod to fill missing values in a column, especially when the missing values are a result of no trading activity. - Normalize data: Use the formula (returns - returns.min()) / (returns.max() - returns.min()) to normalize data to a range of 0 to 1.
- Remove duplicates: Use the
drop_duplicatesmethod with the subset parameter to remove duplicate rows based on specific columns. - Data types: Be aware of the data types in each column and convert them as needed (e.g., from object to float64).
- GroupBy: Use the groupby method to perform operations on groups of data (e.g., filling missing values for each fund).