Note
- This tutorial is also available on nbviewer, offering an alternative platform for your learning convenience.
- 🔥 Free Pandas Course: https://hedaro.gumroad.com/l/tqqfq
Description:
You’re a data scientist at a leading travel company, and you’ve been tasked with analyzing customer booking behavior to inform marketing strategies. Your team has collected data on customer bookings, including demographics, travel dates, and accommodation types. However, the data is scattered across multiple sources and needs to be cleaned, merged, and transformed before analysis can begin.
Tasks:
- Merge: Combine the customer demographics and booking data into a single DataFrame.
- Feature Engineering: Take the merged data from Task #1 and reshape it to create a customer-centric view.
- Group and Aggregate: Group the data by region and accommodation type, and calculate key metrics such as total booking value, average booking value, and count of bookings. Then, sort and rank the results to identify top-performing regions and accommodation types.
# import libraries
import pandas as pd
import matplotlib.pyplot as plt
import numpy as np
import sys

print('Python version ' + sys.version)
print('Pandas version ' + pd.__version__)
print('Numpy version ' + np.__version__)
Python version 3.11.7 | packaged by Anaconda, Inc. | (main, Dec 15 2023, 18:05:47) [MSC v.1916 64 bit (AMD64)]
Pandas version 2.2.1
Numpy version 1.26.4
The Data
The data is designed to mimic real-world travel industry data, with a focus on customer booking behavior and preferences.
customer_demographics:
- customer_id (unique identifier)
- age (integer)
- region (categorical)
booking_data:
- booking_id (unique identifier)
- customer_id (foreign key referencing customer_demographics)
- travel_date (datetime)
- accommodation_type (categorical)
- booking_value (integer)
- booking_status (categorical)
# set the seed
np.random.seed(0)

# customer demographics
customer_demographics = pd.DataFrame({
    'customer_id': np.arange(1, 10001),
    'age': np.random.randint(18, 65, 10000),
    'region': np.random.choice(['North', 'South', 'East', 'West'], 10000)
})

# booking data
booking_data = pd.DataFrame({
    'booking_id': np.arange(1, 50001),
    'customer_id': np.random.randint(1, 10000, 50000),
    'travel_date': pd.date_range('2022-01-01', periods=50000),
    'accommodation_type': np.random.choice(['Hotel', 'Hostel', 'Vacation Rental'], 50000)
})

# additional columns
booking_data['booking_value'] = np.random.randint(100, 1000, 50000)
booking_data['booking_status'] = np.random.choice(['Confirmed', 'Cancelled'], 50000)
Let us make sure the data types are correct for both of the dataframes.
customer_demographics.info()<class 'pandas.core.frame.DataFrame'>
RangeIndex: 10000 entries, 0 to 9999
Data columns (total 3 columns):
# Column Non-Null Count Dtype
--- ------ -------------- -----
0 customer_id 10000 non-null int32
1 age 10000 non-null int32
2 region 10000 non-null object
dtypes: int32(2), object(1)
memory usage: 156.4+ KB
And here is the information for the booking_data.
booking_data.info()<class 'pandas.core.frame.DataFrame'>
RangeIndex: 50000 entries, 0 to 49999
Data columns (total 6 columns):
# Column Non-Null Count Dtype
--- ------ -------------- -----
0 booking_id 50000 non-null int32
1 customer_id 50000 non-null int32
2 travel_date 50000 non-null datetime64[ns]
3 accommodation_type 50000 non-null object
4 booking_value 50000 non-null int32
5 booking_status 50000 non-null object
dtypes: datetime64[ns](1), int32(3), object(2)
memory usage: 1.7+ MB
Merge:
Combine the customer demographics and booking data into a single DataFrame.
For the merge:
- The main dataset is booking_data and any additional columns will come from the customer_demographics dataframe. We accomplish this by using a left join.
- The common column we will merge on is called “customer_id”.
# merge the dataframes
new_df = booking_data.merge(customer_demographics, how='left', on='customer_id')
new_df.head()| booking_id | customer_id | travel_date | accommodation_type | booking_value | booking_status | age | region | |
|---|---|---|---|---|---|---|---|---|
| 0 | 1 | 3945 | 2022-01-01 | Hotel | 964 | Confirmed | 44 | East |
| 1 | 2 | 8165 | 2022-01-02 | Hostel | 603 | Cancelled | 55 | South |
| 2 | 3 | 7863 | 2022-01-03 | Vacation Rental | 395 | Confirmed | 62 | South |
| 3 | 4 | 6775 | 2022-01-04 | Hostel | 566 | Cancelled | 30 | South |
| 4 | 5 | 2485 | 2022-01-05 | Hotel | 776 | Cancelled | 24 | North |
Feature Engineering
Take the merged data from Task #1 and reshape it to create a customer-centric view.
To reshape the data, let us follow the directions below:
Use the pivot_table function to create a new DataFrame with the following structure:
Index:
- customer_id
Columns:
- age (from customer_demographics)
- region (from customer_demographics)
- total_bookings (count of bookings per customer)
- total_booking_value (sum of booking values per customer)
- favorite_accommodation_type (mode of accommodation types per customer)
This will create a customer-centric view with summarized booking information for each customer.
pivot = new_df.pivot_table(index='customer_id',
			  values=['booking_id', 'booking_value', 'accommodation_type'],
			  aggfunc={'booking_id': 'count',
					   'booking_value': 'sum',
					   'accommodation_type': lambda x: x.mode().iloc[0]})
Now all we need to do is rename the columns.
# the json format makes it easy to rename the columns
pivot = pivot.rename(columns={'booking_id': 'total_bookings',
                      'booking_value': 'total_booking_value',
                      'accommodation_type': 'favorite_accommodation_type'})

pivot.head()| favorite_accommodation_type | total_bookings | total_booking_value | |
|---|---|---|---|
| customer_id | |||
| 1 | Hotel | 6 | 2959 |
| 2 | Hotel | 5 | 3108 |
| 3 | Vacation Rental | 3 | 2043 |
| 4 | Vacation Rental | 4 | 2568 |
| 5 | Hotel | 9 | 3356 |
Group and Aggregate
Group the data by region and accommodation type, and calculate key metrics such as total booking value, average booking value, and count of bookings. Then, sort and rank the results to identify top-performing regions and accommodation types.
# create group object
group = new_df.groupby(['region','accommodation_type'])

# calculate total booking value, average booking value, and count of bookings
metrics = group.agg(
     total_booking_value=pd.NamedAgg(column="booking_value", aggfunc="sum"),
     avg_booking_value=pd.NamedAgg(column="booking_value", aggfunc="mean"),
     count_of_bookings=pd.NamedAgg(column="booking_value", aggfunc="count")
)

metrics.head()| total_booking_value | avg_booking_value | count_of_bookings | ||
|---|---|---|---|---|
| region | accommodation_type | |||
| East | Hostel | 2353019 | 550.542583 | 4274 |
| Hotel | 2320282 | 545.050975 | 4257 | |
| Vacation Rental | 2326865 | 553.883599 | 4201 | |
| North | Hostel | 2356863 | 548.362727 | 4298 |
| Hotel | 2309074 | 552.674485 | 4178 |
We can sort the data to identify which region/accommodation_type had the most bookings.
According to the data, Hostels in the North region had the highest count of bookings.
metrics.sort_values(by='count_of_bookings', ascending=False)| total_booking_value | avg_booking_value | count_of_bookings | ||
|---|---|---|---|---|
| region | accommodation_type | |||
| North | Hostel | 2356863 | 548.362727 | 4298 |
| East | Hostel | 2353019 | 550.542583 | 4274 |
| Hotel | 2320282 | 545.050975 | 4257 | |
| Vacation Rental | 2326865 | 553.883599 | 4201 | |
| North | Hotel | 2309074 | 552.674485 | 4178 |
| South | Hotel | 2290785 | 549.744420 | 4167 |
| West | Hotel | 2294852 | 552.443909 | 4154 |
| North | Vacation Rental | 2267620 | 548.529269 | 4134 |
| West | Vacation Rental | 2279817 | 552.013801 | 4130 |
| South | Vacation Rental | 2244830 | 548.188034 | 4095 |
| West | Hostel | 2220775 | 546.988916 | 4060 |
| South | Hostel | 2224943 | 549.097483 | 4052 |
We can also try to plot the data to visually attempt to uncover patterns.
From the charts below, what I can spot pretty easily is that price is an important factor. We can see places like the East Hotel and the North Hostel have a healthy number of bookings. My best guess is that the low price is convincing people to book. What do you think?
# this section is used to dynamically create the subplot row and column
num_columns = len(metrics.columns)
num_rows = (num_columns + 1) // 2  # we want to only have 2 columns of plots
num_cols = 2

# you can adjust the figsize to your preference here
fig, axs = plt.subplots(nrows=num_rows, ncols=num_cols, figsize=(12,4*len(metrics.columns)))

# create space between plots
fig.subplots_adjust(hspace=2.0)

# this is to avoid having to deal with dynamically determining the rows,column on the loop below
axs = axs.flatten()

# loop through each column and create a bar chart
for i, column in enumerate(metrics.columns):
    metrics[column].sort_values().plot.barh(ax=axs[i])
    axs[i].set_title(f'{column}')

# hide any unused axes
for i in range(len(metrics.columns), len(axs)):
    axs[i].axis('off')

fig.tight_layout()
plt.show()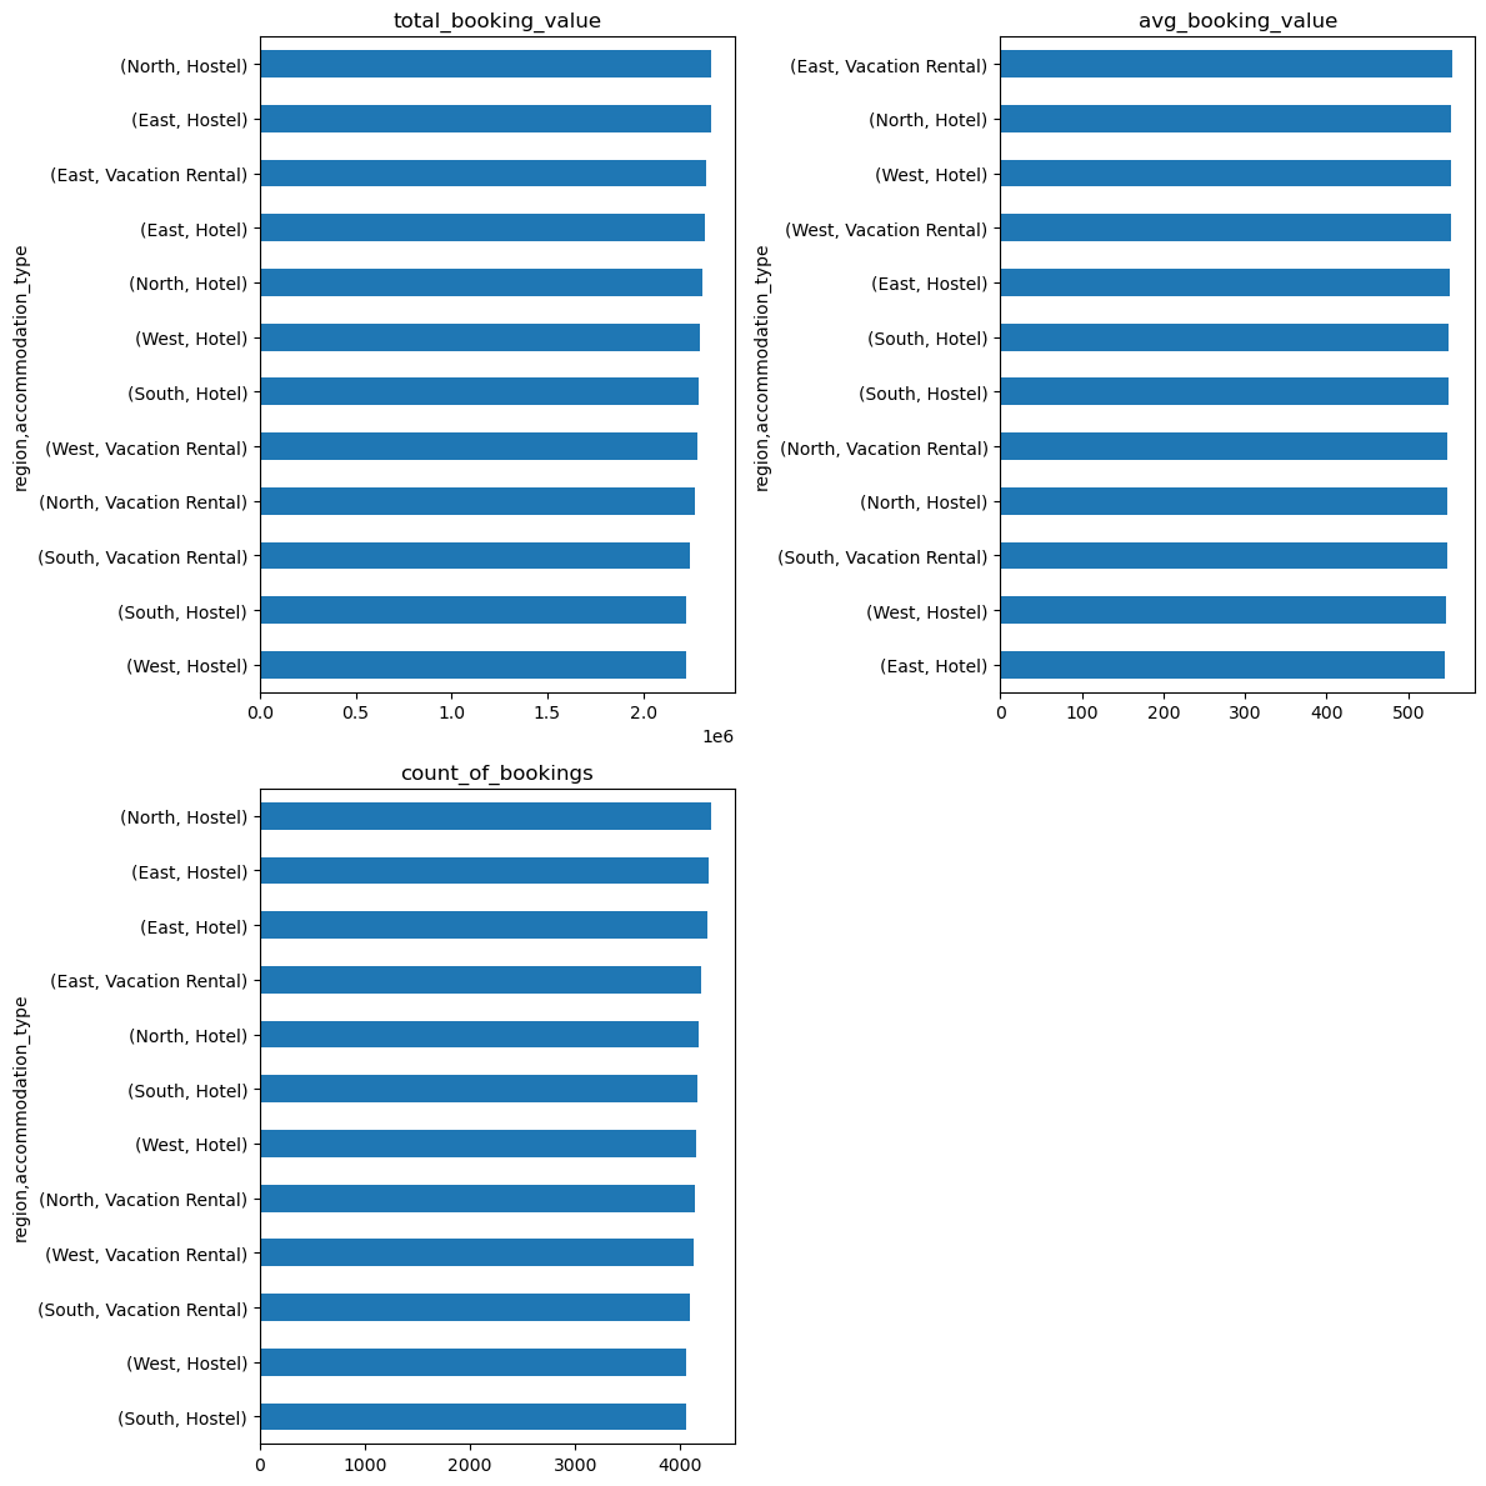
Summary
This tutorial guides you through analyzing customer booking behavior for a travel company using Pandas, covering tasks such as merging and reshaping data, grouping and aggregating data, and visualizing results to identify trends and patterns. By the end of the tutorial, you’ll have a comprehensive understanding of how to clean, transform, and analyze data to inform marketing strategies.
Key Takeaways:
- Merging data from multiple sources using
pd.merge() - Using
pivot_table()to reshape data and create a customer-centric view - Grouping and aggregating data using
groupby()andagg() - Calculating key metrics such as total booking value, average booking value, and count of bookings
- Sorting and ranking data to identify top-performing regions and accommodation types
- Visualizing data using bar charts to uncover patterns and trends