Note
- This tutorial is also available on nbviewer, offering an alternative platform for your learning convenience.
- 🔥 Free Pandas Course: https://hedaro.gumroad.com/l/tqqfq
Description
It’s election season, and the Democratic National Committee (DNC) and the Republican National Committee (RNC) need your help analyzing voter demographics and donation data to inform campaign strategies.
Tasks
- Merge the voter demographics and donation dataframes on the voter ID column and calculate the total donations received from each state.
- Transform the ‘donation_date’ column to datetime format and extract the month and year of each donation. Then, create a new dataframe showing the total donations received each month, grouped by state.
- Pivot the merged dataframe to show the average donation amount by age group and state.
# import libraries
import pandas as pd
import numpy as np
import sys

print('Python version ' + sys.version)
print('Pandas version ' + pd.__version__)
print('Numpy version ' + np.__version__)
Python version 3.11.7 | packaged by Anaconda, Inc. | (main, Dec 15 2023, 18:05:47) [MSC v.1916 64 bit (AMD64)]
Pandas version 2.2.1
Numpy version 1.26.4
The Data
The dataset consists of two CSV files: “voter_demographics” and “donations”, containing information on 100,000 voters (age, state, party affiliation) and 50,000 donations (date, amount) made by these voters, respectively. The data is synthetic, representing a fictional scenario, and is designed to mimic real-world voter demographics and donation patterns.
Columns:
Voter Demographics:
- voter_id: Unique identifier for each voter.
- state: Two-letter abbreviation for the voter’s state.
- age: Voter’s age.
- party_affiliation: Voter’s party affiliation.
Donations:
- voter_id: Unique identifier for each voter.
- donation_date: Date of donation.
- donation_amount: Amount donated.
# set the seed
np.random.seed(0)

# voter demographics data
voter_demographics = pd.DataFrame({
    'voter_id': range(100000),
    'state': np.random.choice(['AL', 'AK', 'AZ', 'AR', 'CA', 'CO', 'CT', 'DE', 'FL', 'GA'], size=100000),
    'age': np.random.randint(18, 80, size=100000),
    'party_affiliation': np.random.choice(['Democrat', 'Republican', 'Independent'], size=100000)
})

# donation data
donations = pd.DataFrame({
    'voter_id': np.random.choice(range(100000), size=50000),
    'donation_date': pd.date_range('2022-01-01', '2024-11-04', periods=50000),
    'donation_amount': np.random.randint(10, 1000, size=50000)
})

# save dataframes to CSV files
voter_demographics.to_csv('voter_demographics.csv', index=False)
donations.to_csv('donations.csv', index=False)
We will begin by reading the CSV files into memory.
# create dataframes
voter_demographics_df = pd.read_csv('voter_demographics.csv')
donations_df = pd.read_csv('donations.csv')
Let us take a look at the data types.
voter_demographics_df.info()<class 'pandas.core.frame.DataFrame'>
RangeIndex: 100000 entries, 0 to 99999
Data columns (total 4 columns):
# Column Non-Null Count Dtype
--- ------ -------------- -----
0 voter_id 100000 non-null int64
1 state 100000 non-null object
2 age 100000 non-null int64
3 party_affiliation 100000 non-null object
dtypes: int64(2), object(2)
memory usage: 3.1+ MB
Take note that the column named “donation_date” will need to be converted into a date object since it is currently being treated as a string. (see task #2)
donations_df.info()<class 'pandas.core.frame.DataFrame'>
RangeIndex: 50000 entries, 0 to 49999
Data columns (total 3 columns):
# Column Non-Null Count Dtype
--- ------ -------------- -----
0 voter_id 50000 non-null int64
1 donation_date 50000 non-null object
2 donation_amount 50000 non-null int64
dtypes: int64(2), object(1)
memory usage: 1.1+ MB
Task #1
Merge the voter demographics and donation dataframes on the voter ID column and calculate the total donations received from each state.
Note: By default, when using the .merge method, we are performing an inner join. This means we will not include any row where the “voter_id” column does not match between the two dataframes.
# merge the two dataframes
df = voter_demographics_df.merge(donations_df, on='voter_id')
df.head()| voter_id | state | age | party_affiliation | donation_date | donation_amount | |
|---|---|---|---|---|---|---|
| 0 | 0 | CO | 64 | Independent | 2023-12-28 02:17:33.093061864 | 317 |
| 1 | 2 | AR | 49 | Independent | 2022-01-18 04:33:03.495669913 | 857 |
| 2 | 3 | AR | 47 | Democrat | 2022-04-25 06:51:57.806356128 | 296 |
| 3 | 5 | GA | 64 | Independent | 2023-11-25 08:03:14.691893840 | 100 |
| 4 | 6 | AR | 73 | Independent | 2022-06-10 13:57:48.525370508 | 119 |
We will make use of the .groupby method to calculate the total donations received from each state.
Looking at the final results, we can see that California gave the most donations and Arizona gave the least.
# create group object
group = df.groupby('state')

# total donations for the group
group['donation_amount'].sum().sort_values(ascending=False)
state
CA 2598324
AK 2582826
AR 2562748
CT 2522359
DE 2521311
FL 2520236
AL 2490510
CO 2477765
GA 2467164
AZ 2464678
Name: donation_amount, dtype: int64
Task #2
Transform the ‘donation_date’ column to datetime format and extract the month and year of each donation. Then, create a new dataframe showing the total donations received each month, grouped by state.
# convert to date object
df['donation_date'] = pd.to_datetime(df['donation_date'])

# check to make sure it worked
df.info()
<class 'pandas.core.frame.DataFrame'>
RangeIndex: 50000 entries, 0 to 49999
Data columns (total 6 columns):
# Column Non-Null Count Dtype
--- ------ -------------- -----
0 voter_id 50000 non-null int64
1 state 50000 non-null object
2 age 50000 non-null int64
3 party_affiliation 50000 non-null object
4 donation_date 50000 non-null datetime64[ns]
5 donation_amount 50000 non-null int64
dtypes: datetime64[ns](1), int64(3), object(2)
memory usage: 2.3+ MB
# create a new dataframe
df_new = df.loc[:,['state','donation_date','donation_amount']]

# create new month and year columns
df_new['donation_month'] = df_new['donation_date'].dt.month
df_new['donation_year'] = df_new['donation_date'].dt.year

df_new.head()| state | donation_date | donation_amount | donation_month | donation_year | |
|---|---|---|---|---|---|
| 0 | CO | 2023-12-28 02:17:33.093061864 | 317 | 12 | 2023 |
| 1 | AR | 2022-01-18 04:33:03.495669913 | 857 | 1 | 2022 |
| 2 | AR | 2022-04-25 06:51:57.806356128 | 296 | 4 | 2022 |
| 3 | GA | 2023-11-25 08:03:14.691893840 | 100 | 11 | 2023 |
| 4 | AR | 2022-06-10 13:57:48.525370508 | 119 | 6 | 2022 |
# create group object
group = df_new.groupby(['donation_month','state'])

# total donations received by group
group['donation_amount'].sum()
donation_month state
1 AK 227603
AL 221196
AR 246627
AZ 214069
CA 243227
...
12 CO 138175
CT 149352
DE 144633
FL 164114
GA 171758
Name: donation_amount, Length: 120, dtype: int64
Task #3
Pivot the merged dataframe to show the average donation amount by age group and state.
# create group object
group = df.groupby(['state','age'])

# total donations received by group
group['donation_amount'].mean()
state age
AK 18 568.564516
19 507.548780
20 479.083333
21 519.535714
22 491.085714
...
GA 75 493.054795
76 511.250000
77 519.724638
78 505.541667
79 506.794118
Name: donation_amount, Length: 620, dtype: float64
DNC and RNC listen up!
Voters in the 45-54 age bracket give the highest donation amounts. Do you agree?
# create bins for the (18-24), (25-34), (35-44), (45-54) and (55+) categories
bins = [18, 25, 34, 44, 55, float('inf')]

# labels for the three categories
labels = ['18-24', '25-34', '35-44', '45-54', '55+']

# bin it up!
df['age_brackets'] = pd.cut(df['age'], bins=bins, labels=labels, include_lowest=True)

# plot it!
df.groupby('age_brackets', observed=True)['donation_amount'].median().plot();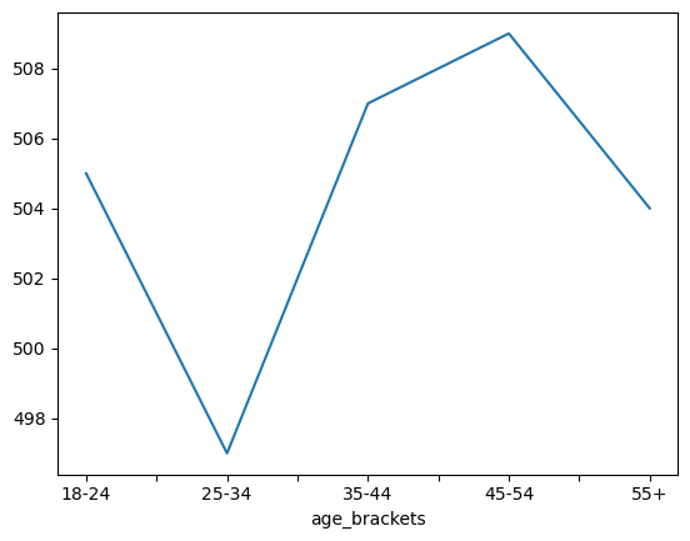
Summary
This tutorial focused on analyzing voter demographics and donation data to assist in election strategies. Using Pandas, various tasks were performed to uncover trends in voter donations across different states, age groups, and time periods.
Key Takeaways:
- Learned how to merge two DataFrames (voter demographics and donations) on a common column (voter_id).
- Calculated total donations received by each state using the
.groupby()and.sum()functions. - Transformed the donation_date column from string to datetime format.
- Extracted month and year from the donation_date for further analysis.
- Visualized the median donation amounts per age bracket, discovering that the 45-54 age group contributed the most.