Note
- This tutorial is also available on nbviewer, offering an alternative platform for your learning convenience.
- 🔥 Free Pandas Course: https://hedaro.gumroad.com/l/tqqfq
Description:
You’re a data analyst at a large healthcare organization, and your team has been tasked with analyzing patient outcomes and hospital resource utilization. Your hospital has implemented a new electronic health record (EHR) system, and you’ve been given access to a large dataset containing patient information, diagnoses, treatments, and outcomes. Your goal is to extract insights from this data to inform quality improvement initiatives and optimize resource allocation.
Tasks:
- Patient Outcome Analysis: Calculate the average length of stay for patients with different diagnoses.
- Resource Utilization: Determine the most common treatments prescribed for patients with a specific diagnosis (e.g., diabetes) and calculate the total cost of these treatments.
- Quality Improvement: Identify patients who were readmitted within 30 days of discharge and analyze the most common reasons for readmission.
# import libraries
import pandas as pd
import numpy as np
import sys

print('Python version ' + sys.version)
print('Pandas version ' + pd.__version__)
print('Numpy version ' + np.__version__)
Python version 3.11.7 | packaged by Anaconda, Inc. | (main, Dec 15 2023, 18:05:47) [MSC v.1916 64 bit (AMD64)]
Pandas version 2.2.1
Numpy version 1.26.4
The Data
The dataset contains patient information, including demographics, diagnoses, treatments, outcomes, length of stay, and costs, as well as readmission data for patients who were readmitted within 30 days of discharge. This dataset represents a realistic scenario for a large healthcare organization, with a mix of categorical and numerical data.
Columns:
- Patient ID: Unique identifier for each patient
- Age: Patient age in years
- Diagnosis: Primary diagnosis for each patient
- Treatment: Primary treatment prescribed for each patient
- Outcome: Outcome for each patient (discharged, readmitted, or deceased)
- Length of Stay: Number of days each patient stayed in the hospital
- Cost: Total cost of treatment for each patient
- Readmission Reason: Reason for readmission (if applicable)
# set the seed
np.random.seed(0)

# generate patient data
patient_data = pd.DataFrame({
    'Patient ID': np.arange(1, 10001),
    'Age': np.random.randint(18, 90, size=10000),
    'Diagnosis': np.random.choice(['Diabetes', 'Heart Failure', 'Pneumonia', 'Cancer', 'Stroke'], size=10000),
    'Treatment': np.random.choice(['Medication', 'Surgery', 'Physical Therapy', 'Chemotherapy', 'Radiation'], size=10000),
    'Outcome': np.random.choice(['Discharged', 'Readmitted', 'Deceased'], size=10000),
    'Length of Stay': np.random.randint(1, 30, size=10000),
    'Cost': np.random.randint(1000, 10000, size=10000)
})

# generate readmission data
readmission_data = pd.DataFrame({
    'Patient ID': np.random.choice(patient_data['Patient ID'], size=2000, replace=False),
    'Readmission Reason': np.random.choice(['Complication', 'Infection', 'Non-compliance', 'Other'], size=2000)
})
Let us look at the two dataframes we created above to make sure the data types are correct.
patient_data.info()<class 'pandas.core.frame.DataFrame'>
RangeIndex: 10000 entries, 0 to 9999
Data columns (total 7 columns):
# Column Non-Null Count Dtype
--- ------ -------------- -----
0 Patient ID 10000 non-null int32
1 Age 10000 non-null int32
2 Diagnosis 10000 non-null object
3 Treatment 10000 non-null object
4 Outcome 10000 non-null object
5 Length of Stay 10000 non-null int32
6 Cost 10000 non-null int32
dtypes: int32(4), object(3)
memory usage: 390.8+ KB
Remember, the data type named “object” is a catch-all data type for columns that contain mixed data types or data that can’t be represented by other dtypes, such as:
- Strings
- Lists
- Dictionaries
- Other objects
The “Readmission Reason” column in the dataframe below contains strings.
readmission_data.info()<class 'pandas.core.frame.DataFrame'>
RangeIndex: 2000 entries, 0 to 1999
Data columns (total 2 columns):
# Column Non-Null Count Dtype
--- ------ -------------- -----
0 Patient ID 2000 non-null int32
1 Readmission Reason 2000 non-null object
dtypes: int32(1), object(1)
memory usage: 23.6+ KB
Patient Outcome Analysis:
Calculate the average length of stay for patients with different diagnoses.
The data indicates that heart failure patients have the longest average length of stay.
# create group object
group = patient_data.groupby('Diagnosis')

# get the average length of stay for group
group['Length of Stay'].mean()
Diagnosis
Cancer 15.043435
Diabetes 14.959919
Heart Failure 15.250129
Pneumonia 14.859920
Stroke 14.989289
Name: Length of Stay, dtype: float64
Resource Utilization:
Determine the most common treatments prescribed for patients with a specific diagnosis (e.g., diabetes) and calculate the total cost of these treatments.
# create group object
group = patient_data.groupby(['Diagnosis','Treatment'])

# get the counts
all = group.count()['Cost'].reset_index(name='Count').sort_values(by=['Diagnosis','Count'], ascending=False)

# get the top 2 treatments per Diagnosis
top2 = all.groupby(['Diagnosis']).head(2).reset_index(drop=True)
top2| Diagnosis | Treatment | Count | |
|---|---|---|---|
| 0 | Stroke | Physical Therapy | 436 |
| 1 | Stroke | Radiation | 426 |
| 2 | Pneumonia | Medication | 414 |
| 3 | Pneumonia | Radiation | 413 |
| 4 | Heart Failure | Physical Therapy | 414 |
| 5 | Heart Failure | Radiation | 391 |
| 6 | Diabetes | Chemotherapy | 408 |
| 7 | Diabetes | Radiation | 404 |
| 8 | Cancer | Surgery | 438 |
| 9 | Cancer | Medication | 416 |
Now that we have the most common treatments per diagnosis. Let us join this dataset with the original patient_data dataset. This will ensure we filter our data to only include the top 2 treatments and then we can get the total cost.
Note: I choose to extract the top 2 treatments to show you the code to accomplish this data wrangling technique.
# filter data to only include top2
filtered = patient_data.merge(top2, left_on=['Diagnosis','Treatment'], right_on=['Diagnosis','Treatment'])

# create group object
group = filtered.groupby(['Diagnosis','Treatment'])

# get total cost
group['Cost'].sum()
Diagnosis Treatment
Cancer Medication 2343712
Surgery 2407609
Diabetes Chemotherapy 2252451
Radiation 2274558
Heart Failure Physical Therapy 2233649
Radiation 2137515
Pneumonia Medication 2183974
Radiation 2249833
Stroke Physical Therapy 2463359
Radiation 2359345
Name: Cost, dtype: int32
Quality Improvement:
Identify patients who were readmitted within 30 days of discharge and analyze the most common reasons for readmission.
We will make the join on the common column named “Patient ID” and do a left join. The reason is that by default Pandas will do an inner join and only return the rows where the two dataframes have matching Patient IDs. We want to inlcude all of the rows in patient_data, even if they don’t have a matching Patient ID on the other dataframe.
# join the two dataframes to get the readmission data
new_df = patient_data.merge(readmission_data, on='Patient ID', how='left')
new_df| Patient ID | Age | Diagnosis | Treatment | Outcome | Length of Stay | Cost | Readmission Reason | |
|---|---|---|---|---|---|---|---|---|
| 0 | 1 | 62 | Cancer | Chemotherapy | Deceased | 11 | 5334 | NaN |
| 1 | 2 | 65 | Heart Failure | Chemotherapy | Readmitted | 2 | 9276 | NaN |
| 2 | 3 | 82 | Stroke | Medication | Readmitted | 1 | 2093 | NaN |
| 3 | 4 | 85 | Cancer | Radiation | Discharged | 23 | 5313 | NaN |
| 4 | 5 | 85 | Diabetes | Surgery | Discharged | 27 | 4569 | NaN |
| … | … | … | … | … | … | … | … | … |
| 9995 | 9996 | 53 | Diabetes | Surgery | Discharged | 25 | 2347 | NaN |
| 9996 | 9997 | 82 | Heart Failure | Radiation | Deceased | 24 | 9782 | NaN |
| 9997 | 9998 | 45 | Heart Failure | Chemotherapy | Deceased | 1 | 4896 | NaN |
| 9998 | 9999 | 32 | Stroke | Surgery | Discharged | 6 | 9465 | NaN |
| 9999 | 10000 | 27 | Diabetes | Medication | Deceased | 7 | 4916 | NaN |
10000 rows × 8 columns
We can now filter the data and visualize it.
note: Since the readmission_data dataset did not provide us with any dates, I used the “length of stay”.
# identify all the rows that had a length of stay within 30 days
within_30_days = new_df['Length of Stay'] < 30

# identify all of the rows that had a readmission reason
readmission = new_df['Readmission Reason'].notnull()

# filtered data
final = new_df[within_30_days & readmission]
final.head()| Patient ID | Age | Diagnosis | Treatment | Outcome | Length of Stay | Cost | Readmission Reason | |
|---|---|---|---|---|---|---|---|---|
| 37 | 38 | 52 | Cancer | Radiation | Readmitted | 7 | 1595 | Infection |
| 41 | 42 | 71 | Diabetes | Medication | Readmitted | 4 | 6443 | Other |
| 52 | 53 | 75 | Stroke | Surgery | Deceased | 25 | 8388 | Infection |
| 53 | 54 | 53 | Diabetes | Physical Therapy | Deceased | 23 | 8769 | Complication |
| 54 | 55 | 29 | Diabetes | Medication | Readmitted | 25 | 6392 | Complication |
Here is a simple bar chart that shows that the most common reason for readmission was “Non-compliance”.
final['Readmission Reason'].value_counts().plot.bar();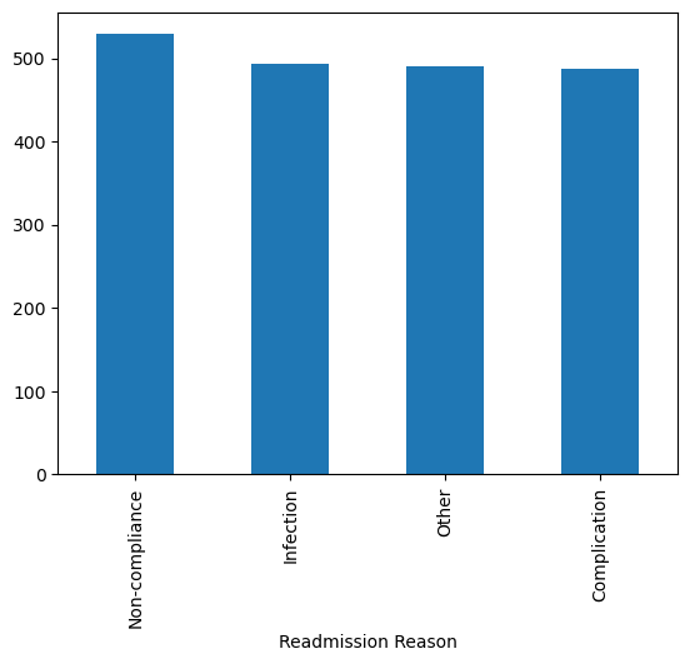
Summary
This tutorial walked you through a clinical data analysis project where we analyzed patient outcomes and hospital resource utilization using a sample dataset. We performed various data analysis tasks, including calculating the average length of stay for patients with different diagnoses, identifying the most common treatments and their costs, and determining the reasons for readmission within 30 days of discharge. Our analysis revealed that heart failure patients had the longest average length of stay, and non-compliance was the most common reason for readmission.
Key Takeaways:
- How to group data by diagnosis and calculate average length of stay
- How to filter data to include only top treatments per diagnosis and calculate total cost
- How to join two dataframes on a common column (Patient ID) and perform a left join
- How to filter data to include only patients readmitted within 30 days and analyze readmission reasons
- How to create a simple bar chart to visualize readmission reasons using Pandas and Matplotlib
PANDAS HOME PAGE