Note
- This tutorial is also available on nbviewer, offering an alternative platform for your learning convenience.
- 🔥 Free Pandas Course: https://hedaro.gumroad.com/l/tqqfq
Description
Your friend owns a small logistics company that specializes in shipping goods across the country. They have been using a manual system to track their shipments, but with the growing number of shipments, they need a more efficient way to manage their data. They have asked for your help to analyze their shipment data and provide insights on how to improve their business.
Tasks
- Task 1: Shipment Time Analysis - Your friend wants to know the average time it takes for shipments to arrive at their destination. Use the dataset to calculate the average shipment time and identify the top 5 routes with the longest shipment times.
- Task 2: Package Weight Distribution - Your friend wants to optimize their packaging process. Use the dataset to calculate the distribution of package weights and identify the most common weight range.
- Task 3: Shipper Performance Analysis - Your friend wants to evaluate the performance of their shippers. Use the dataset to calculate the on-time delivery rate for each shipper and identify the top 3 shippers with the highest on-time delivery rates.
# import libraries
import pandas as pd
import numpy as np
import sys

print('Python version ' + sys.version)
print('Pandas version ' + pd.__version__)
print('Numpy version ' + np.__version__)
Python version 3.11.7 | packaged by Anaconda, Inc. | (main, Dec 15 2023, 18:05:47) [MSC v.1916 64 bit (AMD64)]
Pandas version 2.2.1
Numpy version 1.26.4The Data
The code below generates data that represents a bunch of shipments, with details about who’s shipping them, where they’re going, how heavy they are, and when they were sent and delivered.
Columns:
- shipment_id: This is a unique identifier for each shipment
- shipper: This is the company that’s handling the shipment
- origin: This is the city where the shipment starts its journey
- destination: This is the city where the shipment is headed
- package_weight (kg): This is how heavy the package is, in kilograms
- shipment_date: This is the date when the shipment was sent out
- delivery_date: This is the date when the shipment was delivered
I’ll be honest, I had to do a bit of massaging the data here. I had issues generating dates that looked realistic, with some being too far in the future, but I eventually got something that looks realistic enough for this tutorial.
# set the seed
np.random.seed(0)

# number of data points to generate
shipments = 10000

data = {
'shipment_id': range(1, shipments+1),
'shipper': np.random.choice(['Shipper A', 'Shipper B', 'Shipper C'], shipments),
'origin': np.random.choice(['City A', 'City B', 'City C'], shipments),
'destination': np.random.choice(['City D', 'City E', 'City F'], shipments),
'package_weight': np.random.uniform(1, 100, shipments),
'shipment_date': pd.date_range('2020-01-01', '2024-01-01', periods=shipments)
}

# create dataframe
df = pd.DataFrame(data)

# generate the delivery_date column
df['delivery_date'] = df['shipment_date'] + pd.to_timedelta(np.random.randint(1, 30, shipments), unit='days')

# remove timestamps
df['delivery_date'] = pd.to_datetime(df['delivery_date'].dt.date)
df['shipment_date'] = pd.to_datetime(df['shipment_date'].dt.date)

df| shipment_id | shipper | origin | destination | package_weight | shipment_date | delivery_date | |
|---|---|---|---|---|---|---|---|
| 0 | 1 | Shipper A | City C | City F | 73.070940 | 2020-01-01 | 2020-01-25 |
| 1 | 2 | Shipper B | City A | City E | 30.918563 | 2020-01-01 | 2020-01-27 |
| 2 | 3 | Shipper A | City C | City E | 84.603849 | 2020-01-01 | 2020-01-08 |
| 3 | 4 | Shipper B | City C | City E | 16.533795 | 2020-01-01 | 2020-01-05 |
| 4 | 5 | Shipper B | City B | City D | 16.895606 | 2020-01-01 | 2020-01-08 |
| … | … | … | … | … | … | … | … |
| 9995 | 9996 | Shipper A | City C | City D | 71.514309 | 2023-12-31 | 2024-01-12 |
| 9996 | 9997 | Shipper B | City B | City F | 9.918157 | 2023-12-31 | 2024-01-11 |
| 9997 | 9998 | Shipper B | City B | City E | 26.531780 | 2023-12-31 | 2024-01-11 |
| 9998 | 9999 | Shipper A | City A | City E | 53.675512 | 2023-12-31 | 2024-01-05 |
| 9999 | 10000 | Shipper A | City A | City E | 11.189293 | 2024-01-01 | 2024-01-30 |
10000 rows × 7 columns
Let’s take a look at the datatypes and make sure they look
df.info()<class ‘pandas.core.frame.DataFrame’> RangeIndex: 10000 entries, 0 to 9999 Data columns (total 7 columns):
Column Non-Null Count Dtype
`--- ------ -------------- -----
0 shipment_id 10000 non-null int64
1 shipper 10000 non-null object
2 origin 10000 non-null object
3 destination 10000 non-null object
4 package_weight 10000 non-null float64
5 shipment_date 10000 non-null datetime64[ns]
6 delivery_date 10000 non-null datetime64[ns]
dtypes: datetime64ns, float64(1), int64(1), object(3)
memory usage: 547.0+ KB
Shipment Time Analysis
Your friend wants to know the average time it takes for shipments to arrive at their destinations. Use the dataset to calculate the average shipment time and identify the top 5 routes with the longest shipment times.
# calculate the total shipment time
df['total_shipment_time'] = df['delivery_date'] - df['shipment_date']

df.head()| shipment_id | shipper | origin | destination | package_weight | shipment_date | delivery_date | total_shipment_time | |
|---|---|---|---|---|---|---|---|---|
| 0 | 1 | Shipper A | City C | City F | 73.070940 | 2020-01-01 | 2020-01-25 | 24 days |
| 1 | 2 | Shipper B | City A | City E | 30.918563 | 2020-01-01 | 2020-01-27 | 26 days |
| 2 | 3 | Shipper A | City C | City E | 84.603849 | 2020-01-01 | 2020-01-08 | 7 days |
| 3 | 4 | Shipper B | City C | City E | 16.533795 | 2020-01-01 | 2020-01-05 | 4 days |
| 4 | 5 | Shipper B | City B | City D | 16.895606 | 2020-01-01 | 2020-01-08 | 7 days |
Let’s take a closer look at the total_shipment_time column using the describe() method.
I also pulled the days out of the timedelta column named total_shipment_time. This allows me to get descriptive statistics on a number versus a date object.
To answer the first part of the question, the average shipment time is 15 days.
df['total_shipment_time'].dt.days.describe()count 10000.000000 mean 15.009000 std 8.385508 min 1.000000 25% 8.000000 50% 15.000000 75% 22.000000 max 29.000000 Name: total_shipment_time, dtype: float64
For the second part of the question, I thought all we had to do was order the dataframe and pull out the top 5 rows.
The issue is that we need to find the unique routes and the top 5 rows had duplicates. So I cheated a bit and just pulled more rows and removed the dupes.
What should I have done here?
df.sort_values(by='total_shipment_time', ascending=False).head(8)[['origin','destination']].drop_duplicates()| origin | destination | |
|---|---|---|
| 9999 | City A | City E |
| 5156 | City C | City D |
| 6480 | City B | City D |
| 6418 | City B | City F |
| 889 | City B | City E |
Package Weight Distribution
Your friend wants to optimize their packaging process. Use the dataset to calculate the distribution of package weights and identify the most common weight range.
From the statistics below, most of the packages weigh between 25KG and 75KG.
df['package_weight'].describe()count 10000.000000 mean 50.532313 std 28.634233 min 1.034149 25% 25.625208 50% 51.006958 75% 75.310373 max 99.985707 Name: package_weight, dtype: float64
Let’s plot the data to confirm. This would also be a good chart to show my friend and explain where most of the weights fall under.
df['package_weight'].plot.box();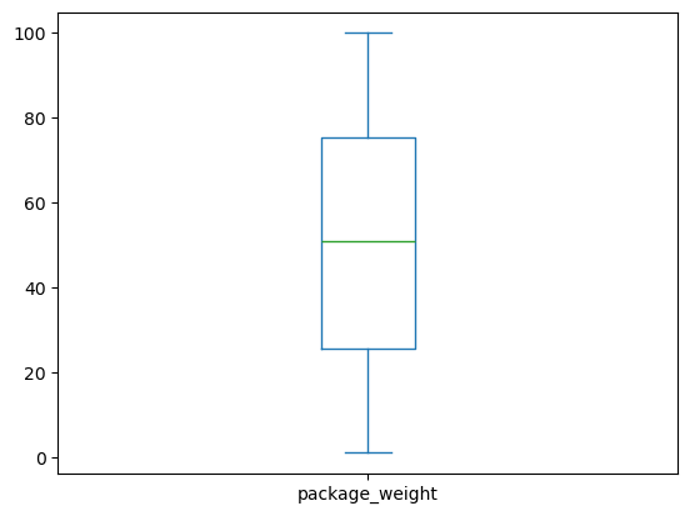
Shipper Performance Analysis
Your friend wants to evaluate the performance of their shippers. Use the dataset to calculate the on-time delivery rate for each shipper and identify the top 3 shippers with the highest on-time delivery rates.
# clean up data for analysis

# using .copy() to avoid issues creating a new column and setting it to a copy of the dataframe
shipper = df[['shipper', 'total_shipment_time']].copy()
shipper['total_days'] = shipper['total_shipment_time'].dt.days

# drop total_shipment_time
del shipper['total_shipment_time']

# create grouping object
group = shipper.groupby('shipper')

# calculate the median against group
group.median()['total_days']
shipper Shipper A 15.0 Shipper B 15.0 Shipper C 15.0 Name: total_days, dtype: float64
Unfortunately, synthetic data is not always the greatest. It seems that my friend can use any shipper, as they all perform basically the same.
group.describe()| total_days | ||||||||
|---|---|---|---|---|---|---|---|---|
| count | mean | std | min | 25% | 50% | 75% | max | |
| shipper | ||||||||
| Shipper A | 3347.0 | 14.873319 | 8.485110 | 1.0 | 7.0 | 15.0 | 22.0 | 29.0 |
| Shipper B | 3413.0 | 15.060357 | 8.331348 | 1.0 | 8.0 | 15.0 | 22.0 | 29.0 |
| Shipper C | 3240.0 | 15.095062 | 8.339595 | 1.0 | 8.0 | 15.0 | 22.0 | 29.0 |